Map Parans

Contents
The Map Parans report is a listing of paran lines intermingled with cities, arranged in order of latitude from northernmost to southernmost. (For an explanation of parans, see Displaying Lines.)
>> |
To see the Map Parans listing for the current chart and map |
Select the “Map Parans...“ item from the “Reports“ menu.
This will display the ‚ÄúMap Paran Report‚ÄĚ dialog box.
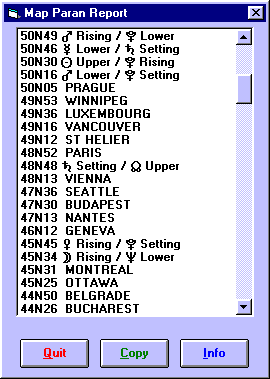
Each line in the listing starts with a latitude, followed either by the city name or by the paran type. For example, in the above listing, the city Paris is shown to be 48 degrees and 52 minutes north, and the paran line of Saturn setting and North Node at upper culmination is shown to be at 48 degrees and 48 minutes north. This indicates that the energy of the Saturn/Node paran line will be strong in Paris (or any other city near that latitude).
The range of latitude covered in this listing depends on two things. Firstly it depends on the current limit of latitude for paran lines, which may be altered on the ‚ÄúSelect Lines‚ÄĚ dialog box (see Displaying Lines for instructions on how to do this.) This is normally a range from 60¬ļ north to 60¬ļ south unless you have chosen to alter it. Secondly it is limited by the latitudinal extent of the map which is currently displayed. For example, if you are viewing a map of Australia, then the map extends from about 6¬ļ south to 50¬ļ south. In this case, you would not see any entries at all in the northern hemisphere.
The cities which are included in this listing depend on the city file which is associated with the current map. For example, the above listing was produced whilst a world map was being viewed, and this map had the world.smc file associated with it. If necessary, you can select a different city file. See Editing Cities for instructions on how to do this.
>> |
To view an interpretation of any paran line in the report |
Click on the required entry in the listing and click on the “Info“ button, or double click on the required entry in the listing.
In either case, you will then see the interpretations window with text relating to the selected entry in the listing. If you do this for a city entry, then you will see the city’s latitude and longitude displayed instead of an interpretation.
>> |
To copy the report text to the clipboard |
Click on the ‚ÄúCopy‚ÄĚ button
>> |
To return to the map |
Click on the “Quit“ button.