Using the Mouse

Contents
The mouse may be used to perform eight different modes of action. These modes are
ŌĆó |
General ŌĆō To display latitude and longitude or Ascendant and Midheaven position |
ŌĆó |
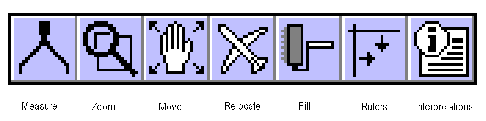
Measure - To Measure Distance or Angular Separation on the Map |
ŌĆó |
Zoom - To Zoom into a Region on the Map |
ŌĆó |
Move - To Move and Reposition the Map |
ŌĆó |
Relocate - To Relocate the Currently Displayed Chart |
ŌĆó |
Fill - To Fill Regions of the Map with Color |
ŌĆó |
Rulers - To Place and Move Rulers on the Map |
ŌĆó |
Interpretations ŌĆō To view interpretations of planetary chart lines on the map, or relocation reports |
The mouse General mode is active in combination with any of the other modes, and cannot be selected on its own.
>> |
To switch the mouse into any one of the modes |
Select the required mode from the ŌĆ£Mouse ModeŌĆ£ item under the ŌĆ£OptionsŌĆ£ menu
or
Select the required mouse mode button from the button panel.
The way in which the mouse behaves under each mode is listed below. In each case, to cancel the mouse action before the button is released, you may use the ŌĆ£EscŌĆ£ button on your keyboard.
ŌĆó |
General ŌĆō Moving the mouse cursor over the map causes the latitude and longitude of the cursor position to be displayed at the top, left of the screen. Depressing the right-hand mouse button causes the Midheaven and Ascendant of the cursor position for the current chart to be displayed instead. This behaviour works in combination with all other selectable mouse modes. |
ŌĆó |
Measure - Clicking the mouse button down fixes the first measurement point. Dragging the mouse to any other points causes the coordinate box (on the top left of the screen) to display the distance between the two points in terms of angular separation and distance in kilometres and miles. The curved line between the two points shows the great circle line which is the shortest line joining the two points along the EarthŌĆÖs surface. Releasing the mouse button terminates the measurement. |
ŌĆó |
Zoom (Automatic with click) ŌĆō Moving the mouse cursor over the map causes the outlines of other stored maps to be displayed as the mouse moves over them. Clicking the mouse whilst one of these map outlines is displayed will cause a zoom to that pre-defined map area. Clicking the mouse whilst no map outline rectangle is displayed will result in a zoom in by a factor of 3, centred on the cursorŌĆÖs position. |
ŌĆó |
Zoom (User-defined area by dragging) - Clicking the left-hand mouse button down fixes the first corner point for the zoom rectangle. Dragging the mouse to any other point causes the zoom rectangle to grow or shrink accordingly. Note that the zoom rectangle has a fixed aspect ratio (width to height), so the mouse controls only the width of the rectangle, not its height. Releasing the mouse button causes the map to be zoomed into the region selected by the zoom rectangle. |
ŌĆó |
Move - Clicking the mouse button down fixes the movement reference point. Dragging the mouse to any other point displays a line showing the selected movement of the reference point eg. Dragging down would move the map downwards. Releasing the mouse button causes the map to be moved by the selected amount. |
ŌĆó |
Relocate - Clicking the mouse causes a line to be drawn from the chartŌĆÖs location to the current mouse position. (If the chartŌĆÖs location is not shown on the map, then this line may extend off the edge of the map.) Releasing the mouse button causes the chart to be relocated to the current mouse position. If the selected location is near a displayed city point, then the relocation is assumed to be for the stored coordinates of that city. |
ŌĆó |
Fill - Clicking the mouse on any point in the map will cause that region of the map to be filled with either the ŌĆ£Sea Fill ColorŌĆ£ or with a ŌĆ£Special Fill ColorŌĆ£, depending on which of these has been selected from the ŌĆ£MapŌĆ£ menu. See Making Color Selections for further details. |
ŌĆó |
Rulers - Clicking the mouse button down whilst the mouse is above or below the map area causes a new horizontal ruler to appear. This may be dragged to any desired position on the map. Releasing the mouse button causes the ruler to become fixed at that position. Similarly, clicking to either side of the map causes a new vertical ruler to appear. Clicking the mouse anywhere inside the map causes the nearest existing ruler to jump to that location. This may then be dragged and dropped at a new location. Dragging any ruler off the edge of the map and then dropping it causes it to be deleted. |
ŌĆó |
Interpretations ŌĆō Clicking the mouse on any line glyph around the outside of the map, or inside the map, will display an interpretation of that line. Such line glyphs include planet/angle lines, paran lines, eclipse lines etc. Clicking anywhere else on a map will result in the user being asked whether they wish to view a relocation interpretations report for that location, for the current chart. |