Selecting Point Colors

Contents
You can customise the colors used for each point (planet, asteroid, hypothetical planet) when they are drawn onto maps, or viewed in chart wheels or local horizon wheels.
>> |
To select colors for each of the chart points |
Select the ÔÇťPoint Colors...ÔÇť item from the ÔÇťChartÔÇť menu.
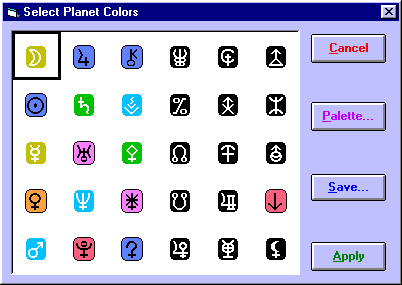
This will display the ÔÇťSelect Planet ColorsÔÇŁ dialog box, showing the current point colors for each point over a background of the current sea fill color.
>> |
To change the displayed color of any individual point |
1. |
Click on the symbol containing the required point or use the cursor keys to move the highlight frame over the required symbol. |
2. |
Click on the ÔÇťPaletteÔÇť button. |
3. |
Select the desired color from the ÔÇťColor SelectionÔÇŁ dialog. |
See Making Color Selections for a description of how to use the ÔÇťColor SelectionÔÇŁ dialog. Once you have selected the color, the dialog box will be updated to show the newly selected color for this point. You can repeat this procedure for as many points as you wish.
When you have finished selecting colors, you then have the option of saving your selected colors for use in future sessions. If you do not save your selections, then any changes that you have made will only apply for the remainder of the current session with Solar Maps, and the color selection will revert to its original setting when you next start up Solar Maps.
>> |
To save your selections for future sessions |
Click on the ÔÇťSave...ÔÇť button.
Whether or not you wish to save the selections for the next session, you can apply these selections to the current chart displayed.
>> |
To apply the selections to the current chart displayed |
Click on the ÔÇťApplyÔÇť button.
The current chart lines will be automatically redrawn with the new color selections.